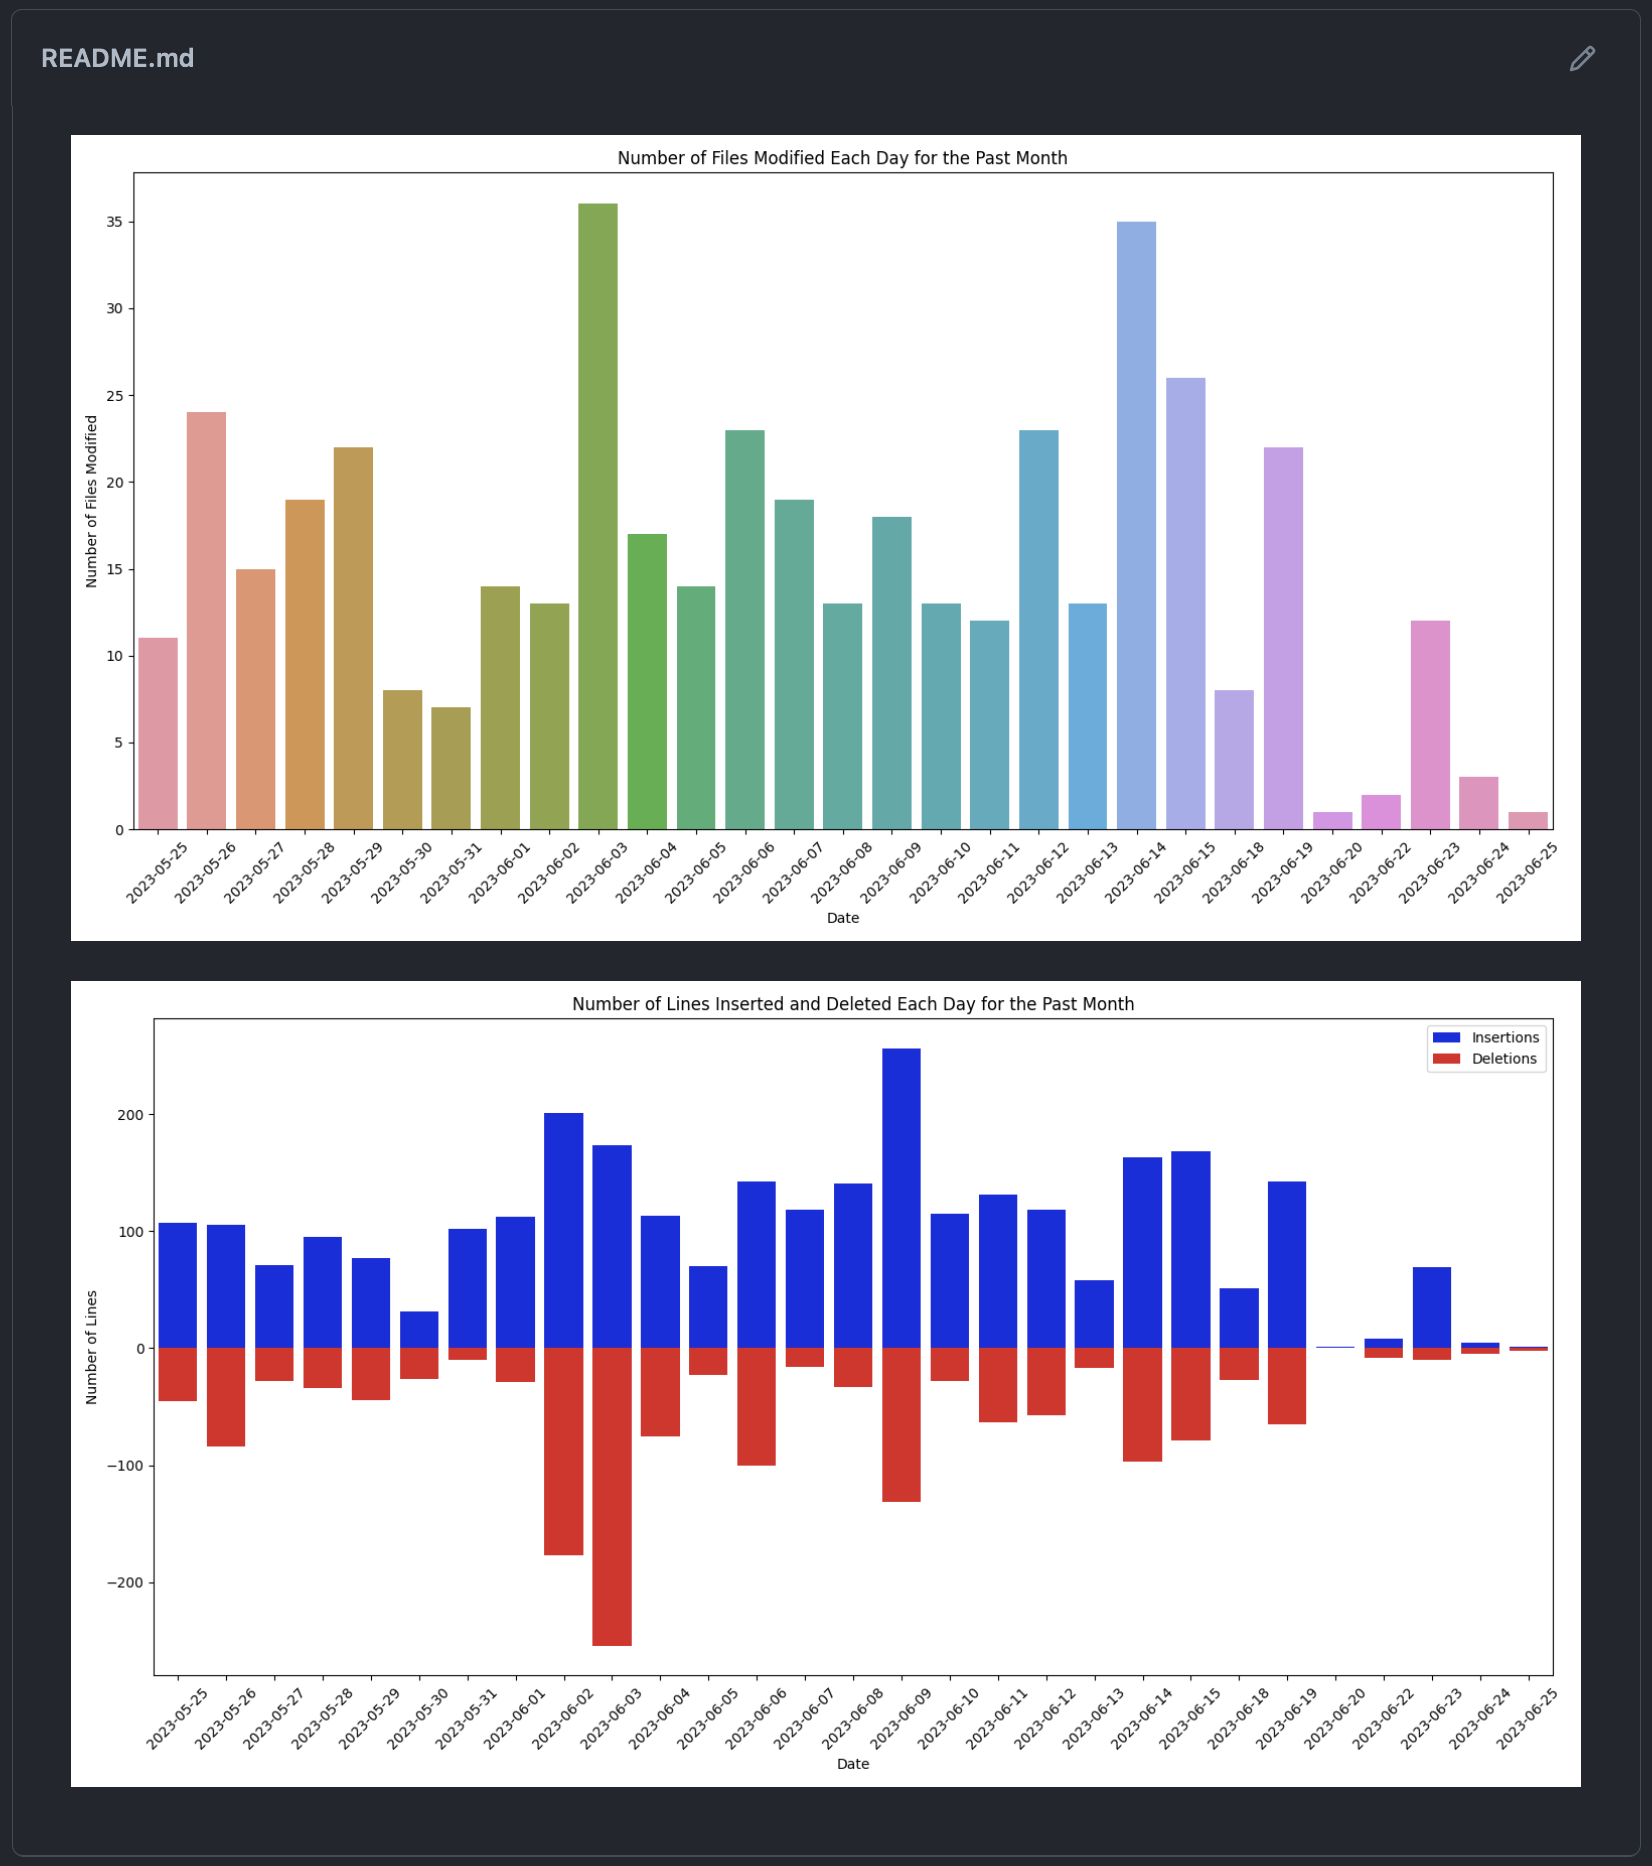
I take a lot of text-based notes, and I've got a script that commits changes to these notes every hour to a private GitHub repo. I find the Git-tracked "lines added" and "lines deleted" to be a fun proxy for productivity. A few months ago, I created a GitHub Action to send me "progress reports" every three days that look like this:
Over the last three days, you've made these changes to Markdown files:
8 files changed, 88 insertions(+), 25 deletions(-)
For context, here are the same statistics for the last thirty days:
185 files changed, 2576 insertions(+), 213 deletions(-)
This has been pretty motivating! I took this a step further by embedding a "dashboard"
into my GitHub README.md. I set up a daily Action to re-generate some useful
plots from Git data, publish the plots as assets for a GitHub Release, and then
link to the Release from the README. It's nice that I can keep overwriting the
assets on an older Release so that the README image URLs can be constant. (I
guess I could also just use the latest Release, but that's a bit less flexible
since we might also want to use the Releases feature in a legitimate way.)

This is basically status badges but with a different indicator of repo health!
(We'd also like to control the Cache-Control header for the Release assets so
we can prevent caching. I think this is what most status badge services do. But I
don't think I can control this for Releases.)